Healthcare Software Development Services
Partner with Romexsoft for medical app development services and secure, scalable, compliant solutions.

The Healthcare Development Services We Provide
Our medical software development services encompass a wide range of capabilities tailored to meet the specific needs of the healthcare industry.

Our expert advice on what to build, how to build it, and how to ensure solutions comply with the regulations. These services include software assessment, identifying system gaps, and crafting strategies to align processes with organizational goals.

Leveraging technologies and deep understanding of the sector’s specifics, we create software products aimed to elevate organization’s impact. The solutions that tackle industry challenges, enhance outcomes, and integrate with any needed processes.

Empowering healthcare professionals by delivering specialized software that addresses practical challenges, enhances real-world workflows, and ensures seamless integration with existing systems for optimal productivity.

We revamp outdated software by introducing the latest and most suitable technologies, ensuring improved performance, scalability, and compatibility with current standards of Healthcare software development.
We enable seamless communication between diverse platforms and systems, ensuring data consistency and interoperability across all touchpoints in healthcare professionals’ daily routines, workflows, and operations.

Get full-scale maintenance and support services to ensure your healthcare applications and infrastructure run smoothly, addressing issues proactively and minimizing downtime.
Explore how our projects reflect understanding of the industry’s challenges and opportunities: from streamlining protocol workflows for multi-site enterprises to developing custom, compliant platforms.


What Sets Us Apart as Healthcare Software Development Company
The way we deliver our services ensures that organizations remain innovative, compliant, and ready for future challenges. Additionally, we prioritize system resilience and uninterrupted operations.
We bridge the gap between healthcare and leading-edge technology, developing digital products that enhance patient care, streamline operations, and improve decision-making. Our technical mastery allows us to create intelligent, scalable applications that enhance efficiency while optimizing costs.

Compliance is a top priority in our development process for the Healthcare sector. We adhere to industry standards such as HIPAA, GDPR, and other regulations. Our team incorporates best practices in data security, encryption, and access controls to ensure your solutions meet all regulations.
We implement disaster recovery strategies, backup solutions, and failover mechanisms to safeguard data and maintain service continuity. Our approach minimizes downtime and ensures providers have uninterrupted access to essential apps, even in the face of unexpected disruptions.
Schedule a Call with Our Healthcare Software Development Experts
Learn how the modern healthcare software development we build can drive substantial growth for your venture.
Custom vs. Platform-Based Solutions
Understand the difference between custom and platform-based healthcare solutions to choose the right approach for your business, users, and compliance needs.
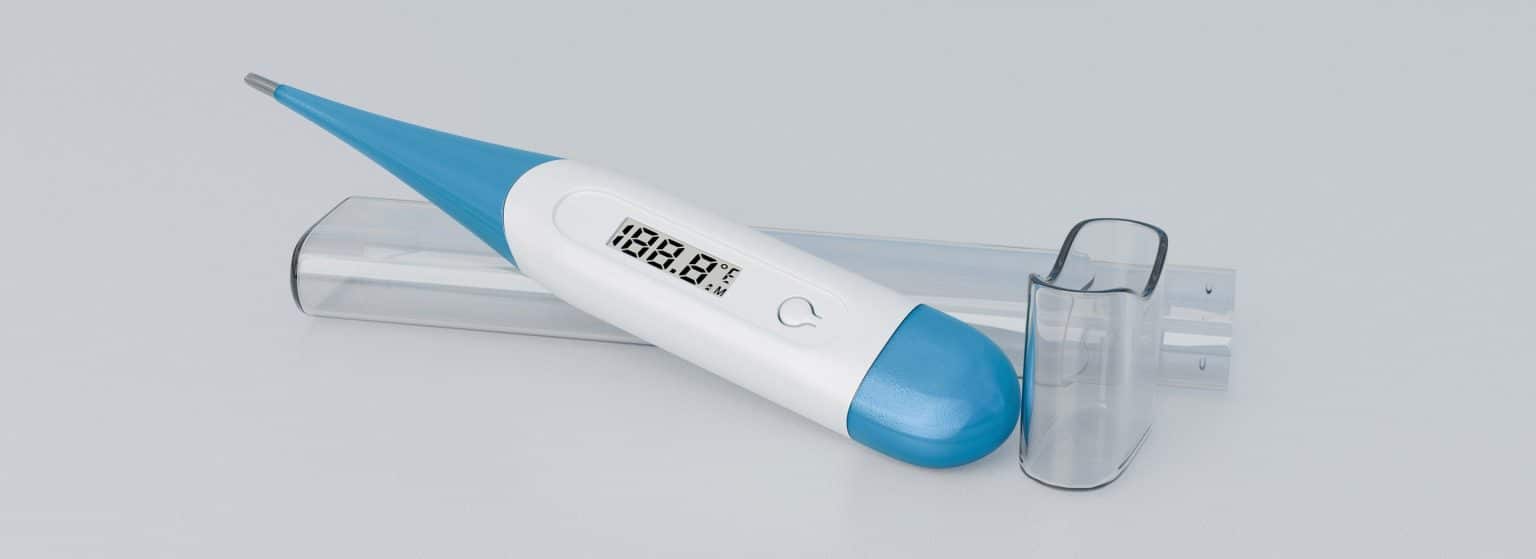
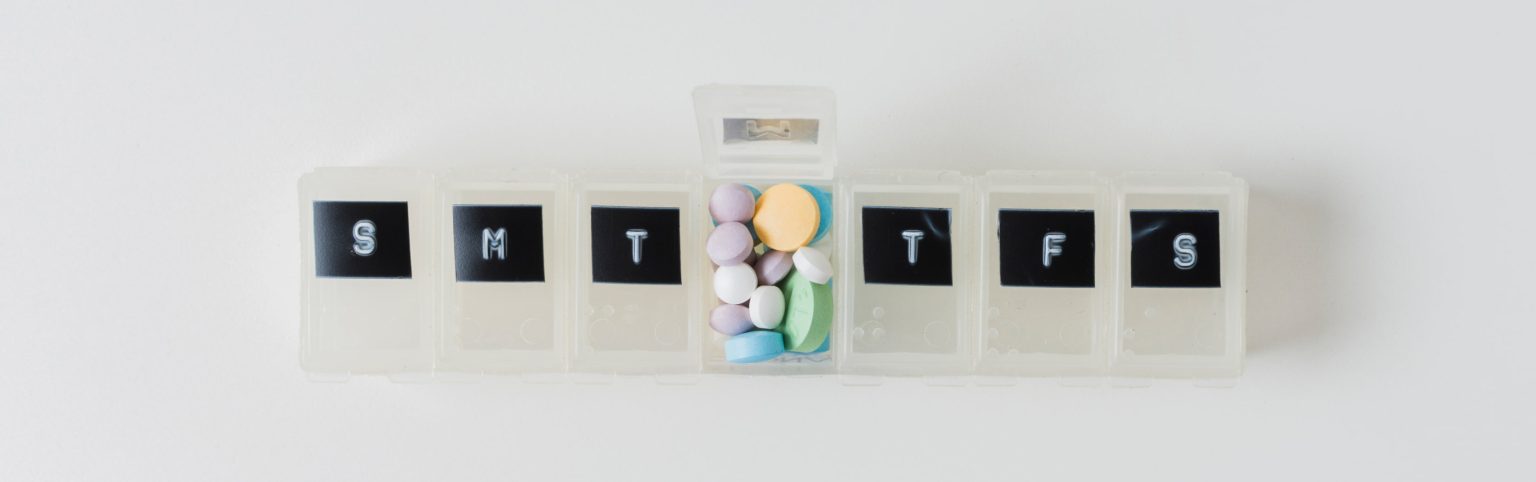
Healthcare Applications and Systems We Build
Based on the industry’s best practices and up-to-date standards, we make sure that the final product meets your boldest expectations.
Electronic Health Records (EHR) Systems
Healthcare CRM Systems
Medical Billing Software
Telemedicine Platforms
Mobile Health Applications
Revenue Cycle Management (RCM)
Radiology Software
Healthcare Analytics Solutions
Strategic Approach to Healthcare Software Development
This typical approach ensures every development project is executed with precision and efficiency. By following a structured process, we deliver solutions that address the unique challenges of the sector.
This phase involves conducting in-depth research, analyzing workflows, and identifying potential opportunities. A detailed strategy is developed to ensure alignment with your organizational objectives and regulatory standards.
Interactive prototypes are created to visualize the functionality and user experience of future applications or specific improvements within the project, enabling feedback and iterative refinements before advancing to full-scale development.
Our engineering efforts mainly focus on ensuring seamless integration with existing systems, high performance, and adherence to industry compliance standards. Agile methodologies are employed to maintain flexibility, efficiency, and security.
Rigorous testing is conducted to ensure every aspect of the solution functions flawlessly. This includes automated and manual testing for performance, usability, security, and compliance. Any issues are addressed promptly to deliver a polished final product.
We oversee the uninterrupted implementation of your solution, ensuring minimal disruption to your operations. This phase includes configuring the system, migrating data, and training your team for a smooth transition to the new platform.
We offer continuous support to keep the solution running optimally, addressing issues promptly and ensuring sustained performance. This includes regular updates, performance monitoring, issue resolution, and scaling capabilities to meet evolving business needs.
Our Expertise in Innovative Technologies for Healthcare
Tech innovations empower providers with precise diagnostics, seamless data management, real-time monitoring, and actionable insights, enabling them to deliver personalized, efficient, and high-quality care.
Technologies We Use for Medical Software Development
Collaboration Models We Offer
Choose the most suitable option, whether you need end-to-end development from scratch, legacy healthcare app modernization or just consulting support, to achieve your goals efficiently.
Augmentation
Team
Frequently Asked Questions
What information do you need to estimate a healthcare software project?
To estimate a healthcare software project, we need to understand the product goals, target users, required features, compliance context, and technical scope.
The most useful inputs include user roles, core workflows, existing documentation or wireframes, integration needs, healthcare data standards such as HL7, FHIR, or DICOM, security and regulatory requirements, expected data volume, cloud preferences, timeline, and budget expectations. If the scope is not fully defined, we can start with a discovery phase to clarify requirements, risks, architecture, and delivery effort.
What are the typical costs of healthcare software development?
The cost depends on various factors, such as project scope, required features, regulatory compliance, and the chosen technology stack. The typical development budgets for healthcare software can vary widely depending on all above mentioned factors. Here are general ranges:
Small-Scale Projects: $50,000 to $150,000.
Includes basic apps like appointment scheduling or health tracking.
Mid-Scale Projects: $150,000 to $500,000.
Covers systems like telemedicine platforms, healthcare CRMs, or EHR/EMR integration.
Large-Scale Projects: $500,000 to $1,000,000+.
Includes complex apps such as enterprise-level EHR systems, AI-driven diagnostics, or IoT-enabled monitoring platforms.
How do you address regulatory requirements when building healthcare software?
We take a holistic approach to compliance, ensuring all software we work with meets the rigorous standards required in the industry. Our process incorporates adherence to key regulations such as HIPAA (Health Insurance Portability and Accountability Act) and HITECH (Health Information Technology for Economic and Clinical Health Act) for data security and privacy. For interoperability, we integrate frameworks like HL7 (Health Level Seven), FHIR (Fast Healthcare Interoperability Resources), and DICOM (Digital Imaging and Communications in Medicine).
To guarantee secure operations and system integrity, we comply with SOC 2 and SSAE requirements for system audits and controls. For software classified as a medical device (SaMD), we follow stringent regulatory protocols to meet approval standards. Additionally, we ensure compliance with GxP (Good Practices) for quality assurance in healthcare and life sciences.
How do you protect patient data in healthcare software?
Patient data security starts with limiting access, securing every data flow, and designing the system around privacy and compliance requirements. This includes encryption at rest and in transit, role-based access control, least-privilege permissions, secure authentication, audit logging, vulnerability management, backup and recovery planning, and regular security testing. For AWS-based healthcare software, we also use relevant AWS security services and follow cloud security best practices to reduce data exposure risks and support compliance requirements.


Explore More
Check out the following resources to gain deeper insights into software development for healthcare and discover how digital solutions can enhance the overall value and responsiveness of your business.