Developing AWS Monitoring Solution for Ecommerce Company
Explore how we established a monitoring solution to safeguard IT infrastructure and elevate operational capabilities.

OUR CUSTOMER
AWS-hosted Ecommerce Application
ECommerce Partners is a leading provider of a full range of internet marketing, website design, support and e-commerce solutions for small and medium businesses in various industries like consumer goods, fashion, lifestyle, entertainment, fitness, food, technology, jewellery, and more. ECommerce Partners helps such famous brands as Castro, Stage Store, C.O. Bigelow, DKNY Home, L’Oréal, Sargento, JCPenney to build and grow their business successfully.
The Challenges
Delivering Cost-Effective Resolution
To improve business outcomes and to prevent downtimes of the existing e-commerce application built on top of the PHP framework and AWS Aurora as a back end, the client asked Romexsoft to build a monitoring solution for the existing AWS production environment to resolve issues before they become critical.
The challenge was to build a cost-effective monitoring solution for log, infrastructure, application and cloud services monitoring. The use of monitoring infrastructure must be cheaper than the use of Splunk and show more information. Another challenge was to collect logs from Rancher and all containers that exist in it with minimum load to the Rancher server and instances.
The Solution
Centralized AWS Monitoring Infrastructure
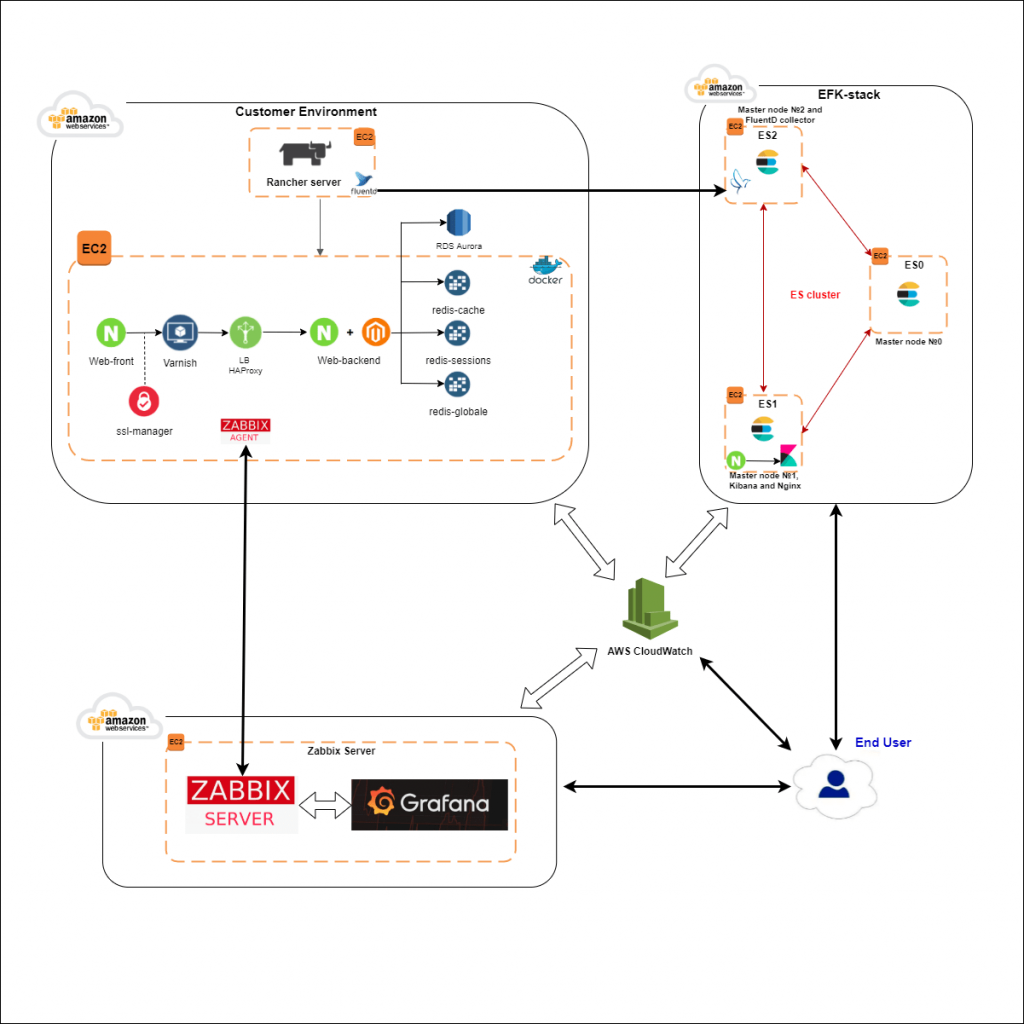
As an AWS consulting company, Romexsoft assessed the client’s existing environment and selected an EFK cluster (Elasticsearch, FluentD and Kibana) for log monitoring, and Zabbix server for infrastructure and service monitoring. The Grafana was chosen to visualize metrics via dashboards. That full-featured interactive dashboard helps observe the whole infrastructure in one place.
The solution is built on top of 3 t3.medium instances for EFK cluster and 1 t3.small instance for Zabbix server and Grafana. Grafana holds the separate dashboards with the information from EFK cluster, Zabbix and CloudWatch.
All tools that we used are available in the public domain and highly flexible. Users can see all the information about the environment in one place (Grafana). EFK cluster written in the Docker-Compose and installed in the container is managed via Rancher like simple containers. This monitoring setup was implemented as part of our DevOps consulting engagement focused on improving operational visibility and reliability of the client’s AWS environment.
Diagram of AWS Infrastructure Monitoring Solution for E-commerce Platform
The Results
Improved Operational Visibility and Infrastructure Reliability
Our DevOps engineers and Solution Architect successfully crafted and implemented an advanced infrastructure monitoring solution. his solution played a pivotal role in safeguarding against costly downtime and elevating the performance of the client’s production system. As a result, the client experienced heightened operational efficiency, fortified business continuity, and an unparalleled customer experience, underscoring the transformative advantages of an exceptionally reliable and high-performing monitoring solution.
Why Romexsoft
Trusted AWS Monitoring Partner
Romexsoft is a certified AWS Advanced Tier Services Partner with a proven and extensive range of experience in DevOps services. As an integral part of the expertise, our specialists design and implement monitoring architectures for AWS environments, enabling operational visibility, downtime prevention and operational efficiency through dashboards, alerting, and centralized observability tools.
Our company also provides:
- Setup of centralized log collection from applications and infrastructure
- Integration of monitoring data into a single operational view for engineers
- Configuration of alerting and notification rules for incident detection
- Deployment and management of the monitoring stack in a container environment.


Frequently Asked Questions
The monitoring solution collects infrastructure metrics, application logs, and cloud service metrics. Infrastructure and service health are monitored through Zabbix, log data is analysed through the EFK stack, and additional cloud metrics are available through the integrated monitoring environment.
Grafana was used as the primary monitoring interface. The platform provided interactive dashboards that visualised data from multiple monitoring sources. It displayed metrics and information from the EFK cluster, infrastructure monitoring tools, and cloud monitoring services, allowing engineers to observe the entire environment in one place.
The monitoring architecture uses a centralized stack that aggregates logs and metrics from the entire environment. Log data from Rancher and its containers is collected and processed through the EFK cluster, while infrastructure and service metrics are monitored separately. All monitoring data is then visualised through Grafana dashboards, allowing engineers to observe the infrastructure in one place. The case does not provide specific details about scaling mechanisms for increased log volume or infrastructure growth.
The monitoring solution centralises logs, infrastructure metrics, and cloud service data, allowing engineers to observe the entire environment from a single place through Grafana dashboards. Log data is collected and analysed through the EFK cluster, while infrastructure and service monitoring are handled separately. Such a unified view helps teams access operational information more easily and identify issues in the production environment. The case does not provide further details about specific troubleshooting workflows or investigation tools.